SDK GUI
Using the SDK GUI tool, invoked with csviz command, you can visually inspect the debugging information in a web browser. For example, you can see:
Routing between PEs, including routing between specific PE coordinates and for a range of the instruction cycles.
Instruction trace. You can see the instructions that were executed, showing the cycle during which an instruction ran, the tasks and uthreads (microthreads) that were executed in a specified PE, and the statistics of the simulation run.
Wavelet trace. View wavelets received at a specified PE, filter the view by colors, wavelet data format and the direction of the wavelets.
PE symbol information.
Invoking the SDK GUI
After you run the simulation of your CSL code using
cslc(see Working With Code Samples), run the commandcsviz <workdir>to invoke the SDK GUI, where<workdir>is the artifacts directory, i.e., the directory in which you ran thecslccommand. The terminal will then display the URL of the SDK GUI page:Attention
You can safely ignore the
ERROR:root:plan.meta not found in current directory or subdirectories. no entries will be displayedmessage.$ csviz . ERROR:root:plan.meta not found in current directory or subdirectories. no entries will be displayed Click this link to open URL: http://user1-dev:8000/?session_id=0e2352dc92 Click this link to open URL: http://172.31.51.216:8000/?session_id=0e2352dc92 Press Ctrl-C to exit
Navigate to the URL from a web browser to see the SDK GUI.
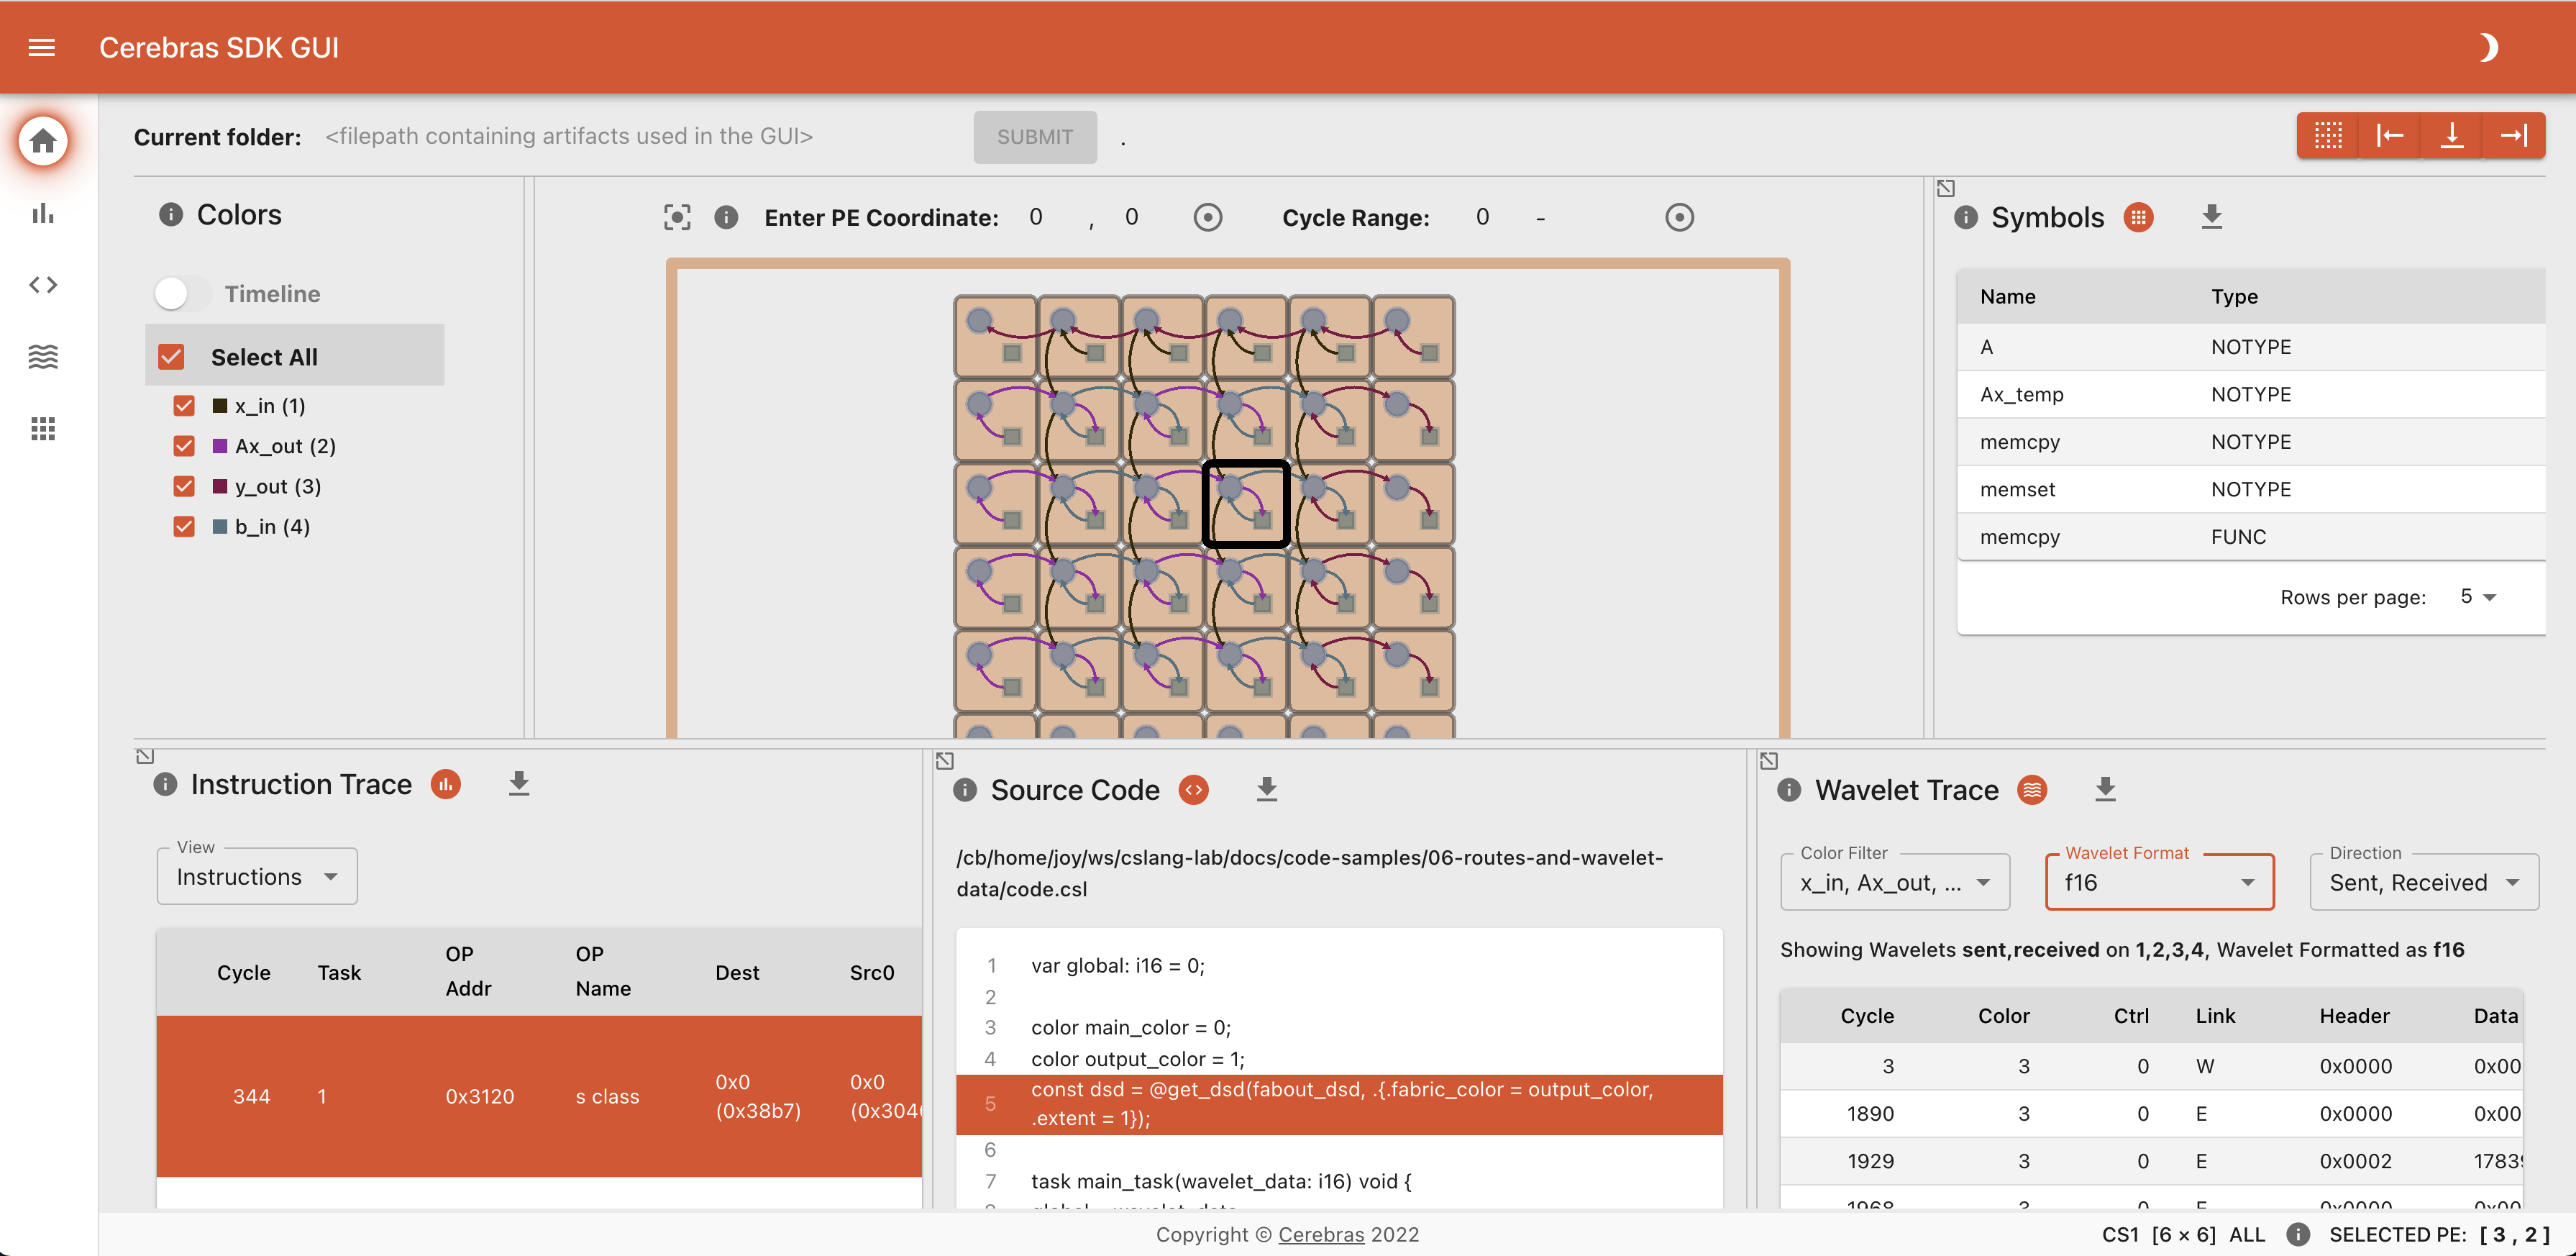
The SDK GUI shows multiple panels, with each panel displaying a different debug metric. Hover the cursor over the shaded i at the top left of any panel to see help text.
Important
If the artifacts in the artifact directory change, then the SDK GUI will continue to show the old artifact data in a cache. To view the new artifacts, restart the SDK GUI.